Creating Predictive Maps for Continuous Variables and Point/CSV Files
We now have the tools we need to create predictive maps. The process below can be used to create maps using a wide variety of modeling approaches including linear models, higher-order polynomial models, tree-based models (CART), Generalized Linear Models (GLMs), and Generalized Additive Models (GAMs.). We'll use this approach in the next three labs to create models with different methods.
-
Create a CSV file with your sample data. This file should contain your response variables and matching predictor variables. There are a variety of ways to create this file but typically you'll:
- Obtain a shapefile of points and measured variables.
- Extract the values from your predictors for your points.
- Export the files as a CSV (BlueSpray) or save it as a shapefile, open the DBF in Excel, and then save it out as a CSV.
- Create your model. Use the methods above to create the model.
- Create your predictive data. This is a CSV that represents your entire sample area and contains columns for the x and y coordinate values and your predictor variable values for those points.
- Start with one of your predictor layers and convert it to a point layer ("To Points" in BlueSpray)
- In BlueSpray:
- Right-click on the point layer and select the attribute table
- Right-click on a column heading in the attribute table and select "Insert Column on Right"
- Give the new attribute a good name and the type of "Double". Click "OK"
- Right click on the attribute heading and select "Extract"
- Select the second predictor layer and select OK. This will add the values from the predictor that contain the specified pixel.
- Repeat steps 2 through 5 for each predictor layer
- Right click on the layer and select "Export to File".
- Give the new file a good name and end it with ".csv" to right out a CSV file.
- Open the CSV in Excel and change the file's column headers to exactly match the one's you used in R to create the model.
- Predict values for the entire sample area. This step adds predictor values to the CSV file you just created.
- Use code similar to the code below to create new predictor values in R.
ThePrediction=predict(TheModel,NewData) # create a vector of predicted values

FinalData=data.frame(NewData,ThePrediction) # combine the new data and the predicted values

write.csv(FinalData, "C:\\Temp\\ModelOutput.csv")  # Save the prediction to a new file
- Load the code into a GIS application and then symbolize the points to see the model!
- You may need to change the file's column headers for the GIS app to use the headers.
- Create a predicted map. The last step is to convert the points into a raster.
- In BlueSpray:
- Right click on the point layer and select "Transforms -> To Raster"
- The only tricky part is picking the correct resolution for the raster to make sure the pixels match the spacing of the points. The resolution should be the same as the original predictor rasters.
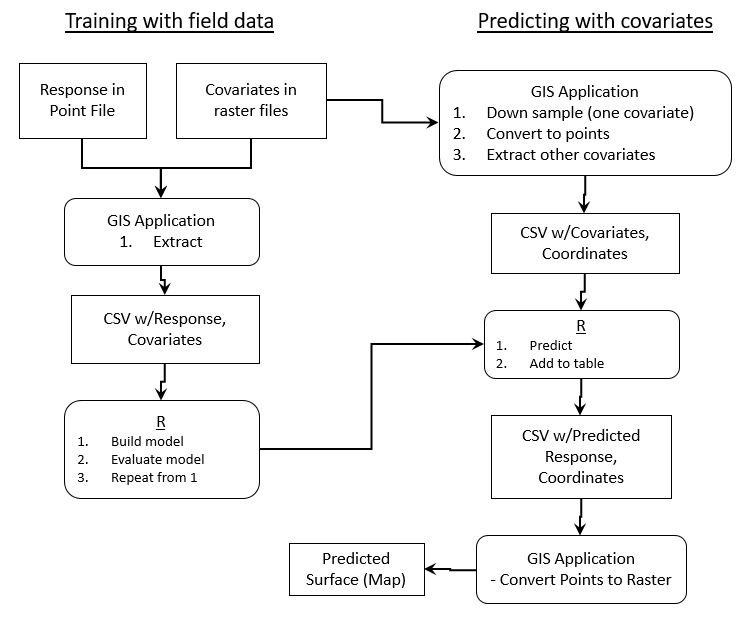
Below is a digram that summarizes this process: